The other day, over on twitter, Todd Vaziri sent a lazyweb request that piqued my interest:
free cinema chart idea
chart the films of steven spielberg and graph the release date minus the year the film takes place
you know, for fun
How does one do timelines these days anyway? I had a vague memory that Google had a tool in their charting APIs.
And they do: Timelines are a feature of Google Charts! Not too hard to set up, really. But I needed the data first. So I started a spreadsheet and started searching Wikipedia and IMDB. I added year of release, and my best guesses as to the year of setting. I also made a distinction for movies set in one period but with an epilogue or prologue in another year (e.g. Schindler’s List and Saving Private Ryan). I didn’t end up using that distinction as it didn’t have much effect on the chart.
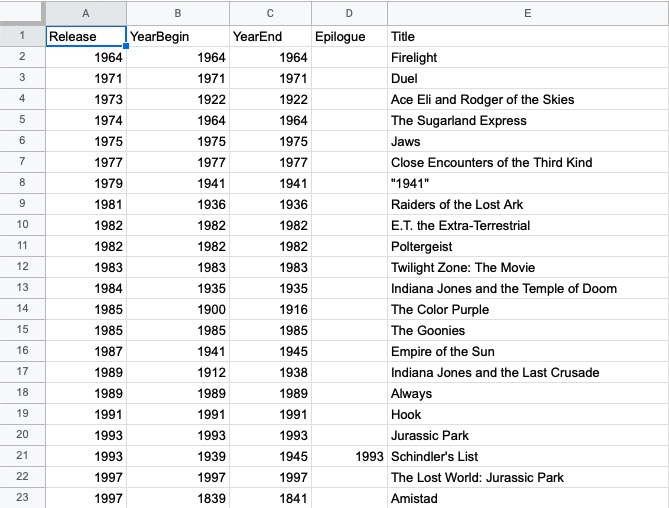
I decided the end points would quite naturally be the average year of the setting year of the film and the year of the film’s release. Start point would be whichever was sooner. For colors I chose a shade of red (#b94e48) and for science fiction I chose a green (#8bbe1b)
I rather like the result:
[codepen_embed height=”900″ theme_id=”light” default_tab=”result” slug_hash=”JjrmEgP” user=”artlung”]See the Pen
Spielberg Timeline by Joe Crawford (@artlung)
on CodePen.[/codepen_embed]
My “client” responded to it favorably:
WOW!
The essence of my question was ‘how many period pictures has SS done’ and it looks like A LOT!
To work it out I used the estimable Codepen, which is terrific for working out small or medium sized web tasks. You can play with it yourself at codepen.io/artlung/pen/JjrmEgP
var futureColor = "#8bbe1b";
var pastColor = "#b94e48";
var nowColor = "#000000";
var epilogueColor = "#cccccc";

google.charts.load("current", { packages: ["timeline"] });
google.charts.setOnLoadCallback(drawChart);
function drawChart() {
	var container = document.getElementById("spielberg-timeline");
	var chart = new google.visualization.Timeline(container);
	var dataTable = new google.visualization.DataTable();

	var rawdata = [
		[1964, 1964, 1964, false, "Firelight"],
		[1971, 1971, 1971, false, "Duel"],
		[1973, 1922, 1922, false, "Ace Eli and Rodger of the Skies"],
		[1974, 1964, 1964, false, "The Sugarland Express"],
		[1975, 1975, 1975, false, "Jaws"],
		[1977, 1977, 1977, false, "Close Encounters of the Third Kind"],
		[1979, 1941, 1941, false, "1941"],
		[1981, 1936, 1936, false, "Raiders of the Lost Ark"],
		[1982, 1982, 1982, false, "E.T. the Extra-Terrestrial"],
		[1982, 1982, 1982, false, "Poltergeist"],
		[1983, 1983, 1983, false, "Twilight Zone: The Movie"],
		[1984, 1935, 1935, false, "Indiana Jones and the Temple of Doom"],
		[1985, 1900, 1916, false, "The Color Purple"],
		[1985, 1985, 1985, false, "The Goonies"],
		[1987, 1941, 1945, false, "Empire of the Sun"],
		[1989, 1912, 1938, false, "Indiana Jones and the Last Crusade"],
		[1989, 1989, 1989, false, "Always"],
		[1991, 1991, 1991, false, "Hook"],
		[1993, 1993, 1993, false, "Jurassic Park"],
		[1993, 1939, 1945, 1993, "Schindler's List"],
		[1997, 1997, 1997, false, "The Lost World: Jurassic Park"],
		[1997, 1839, 1841, false, "Amistad"],
		[1998, 1944, 1944, 1999, "Saving Private Ryan"],
		[2001, 2150, 4150, false, "A.I. Artificial Intelligence"],
		[2002, 2054, 2054, false, "Minority Report"],
		[2002, 1963, 1967, false, "Catch Me If You Can"],
		[2004, 2004, 2005, false, "The Terminal"],
		[2005, 2005, 2005, false, "War of the Worlds"],
		[2005, 1972, 1975, false, "Munich"],
		[
			2008,
			1957,
			1958,
			false,
			"Indiana Jones and the Kingdom of the Crystal Skull"
		],
		[2011, 1949, 1949, false, "The Adventures of Tintin"],
		[2011, 1912, 1918, false, "War Horse"],
		[2012, 1865, 1865, false, "Lincoln"],
		[2015, 1957, 1960, false, "Bridge of Spies"],
		[2016, 1982, 1982, false, "The BFG"],
		[2017, 1966, 1971, false, "The Post"],
		[2018, 2045, 2045, false, "Ready Player One"],
		[2021, 1960, 1960, false, "West Side Story"]
	];

	var massaged_data = [];
	dataTable.addColumn({ type: "string", id: "Movie Year" });
	dataTable.addColumn({ type: "string", id: "Movie Title" });
	dataTable.addColumn({ type: "string", role: "tooltip" });
	dataTable.addColumn({ type: "date", id: "SettingStart" });
	dataTable.addColumn({ type: "date", id: "SettingEnd" });
	var colors = [];

	for (var i = 0; i < rawdata.length; i++) {
		var movie = rawdata[I];
		var averageSetYear = (movie[1] + movie[2]) / 2;
		var madeYear = movie[0];
		var startYear = 0;
		var endYear = 0;
		var tooltip = [movie[4], "was made in", movie[0]].join(" ");
		var epilogueYear = movie[3]; // future if (averageSetYear > madeYear) {
		colors.push(futureColor);
		startYear = madeYear;
		endYear = averageSetYear;
	} else if (averageSetYear < madeYear) {
		colors.push(pastColor);
		startYear = averageSetYear;
		endYear = madeYear;
	} else {
		colors.push(nowColor);
		startYear = madeYear;
		endYear = averageSetYear;
	}

	var movieYearStart = movie[1];
	var movieYearEnd = movie[2];
	var epilogueYear = movie[3];

	if (movieYearStart == movieYearEnd) {
		tooltip += " It is set in " + movieYearStart + ".";
	} else {
		tooltip += " It is set from " + movieYearStart + " to " + movieYearEnd + ".";
	}
	if (epilogueYear) {
		tooltip += " It has an epilogue set in " + epilogueYear + ".";
	}
	massaged_data.push([
		String(i + 1),
		movie[4],
		tooltip,
		new Date(startYear, 1, 1),
		new Date(endYear, 1, 1)
		]);
	}
	dataTable.addRows(massaged_data);

	var options = {
		colors: colors,
		alternatingRowStyle: false,
		avoidOverlappingGridLines: false
	};

	chart.draw(dataTable, options);
}
