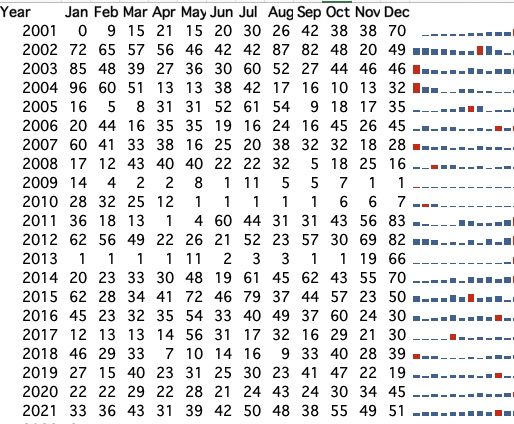
I attended Jordan Goldmeier’s (advancedxl.com) seminar on data visualization in Excel via one of Creative Morning‘s Field Trips. It is far easier to do cool stuff in Excel than I remember. Behold a sparkline bar graph of my ArtLung blog post counts by month since 2001.