Tags · visualization
-
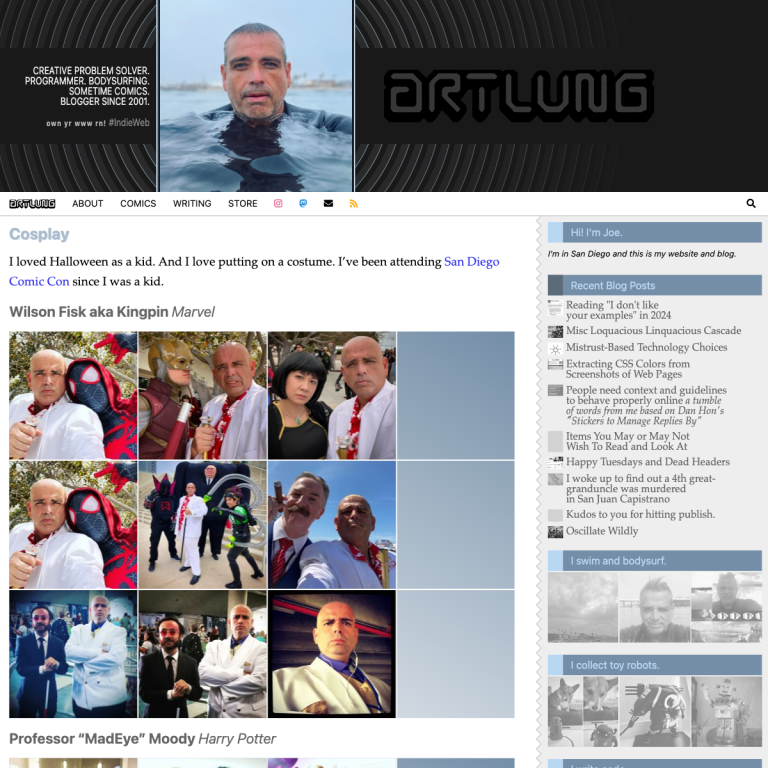
During my sabbatical I’ve learned a lot. One of the things I’ve done is made it easier to create new pages on my website at artlung dot com. I use #WordPress with a theme and plugins I wrote myself. I’ve got 20 years of posts and photos and it’s easy for it to get lost. So yesterday I made a page that I can update periodically, and as I add new cosplays, for example with a hashtag of #qcosplay it will show up on this page. My intent is to show off more of my PHP development, comics, drawings, and toy robots this way. As much as I appreciate Instagram, I wish it were easier to do this kind of thing for my posts on IG, but a website YOU control is the only way to control the way you present yourself and whether you can reach people you’d like to reach.
-
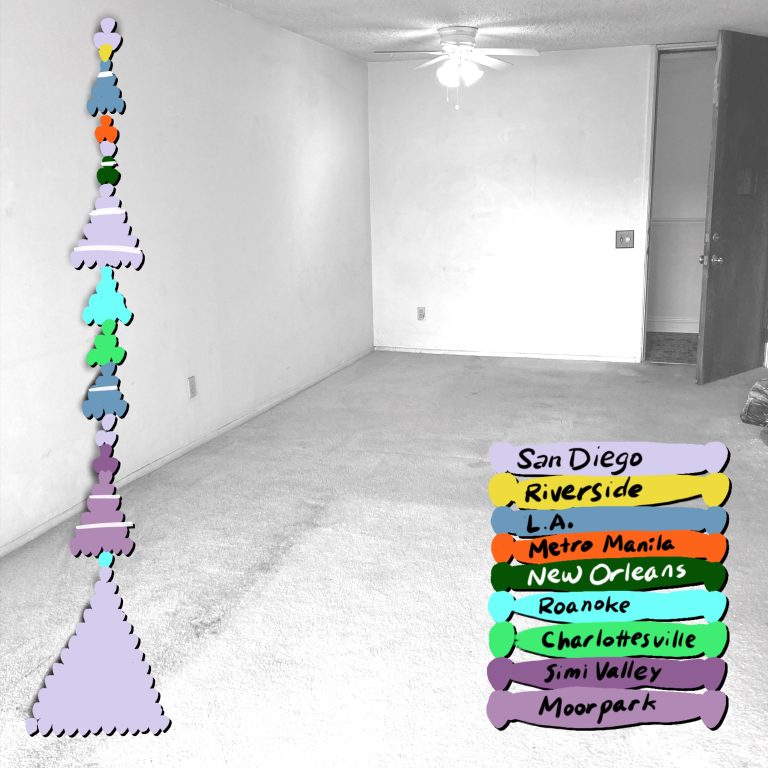
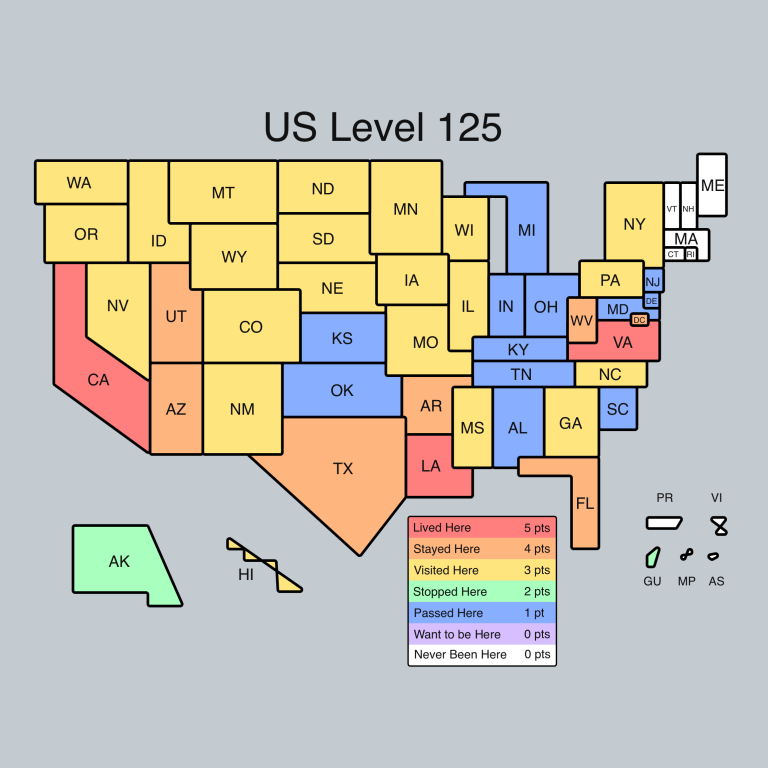
I’ve moved so much I’m not totally sure how many. 22. Depending on how long you have to live somewhere to make it count as a move. My most recent move happened fast. I lived in that apartment longer than I’ve lived anywhere else in my life, and this is the longest years in a row I’ve ever lived in any city. It feels good to have a home I like. Moving is dislocation and disruption; it’s hard in any circumstance. I’ve moved broke, depressed, divorced, unemployed. Here at the end of 2022 I’m happy and working and creating and I’ve got family and friends and the means to take action and a I have a terrific girlfriend I’m moving in with. Here’s to 2023!
-
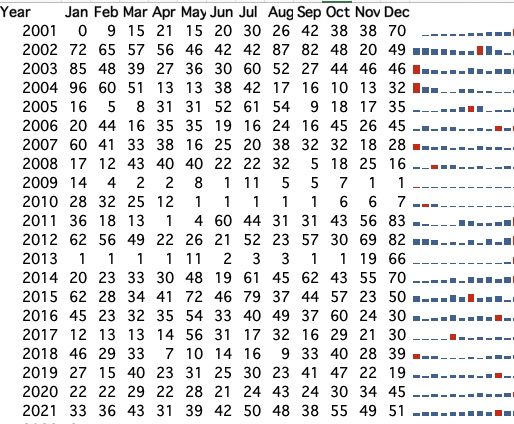
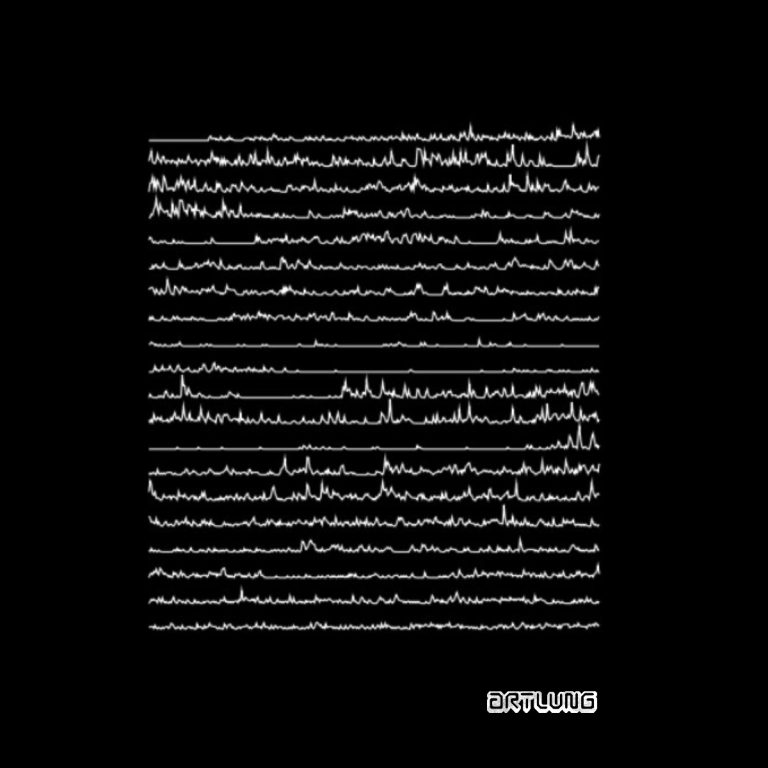
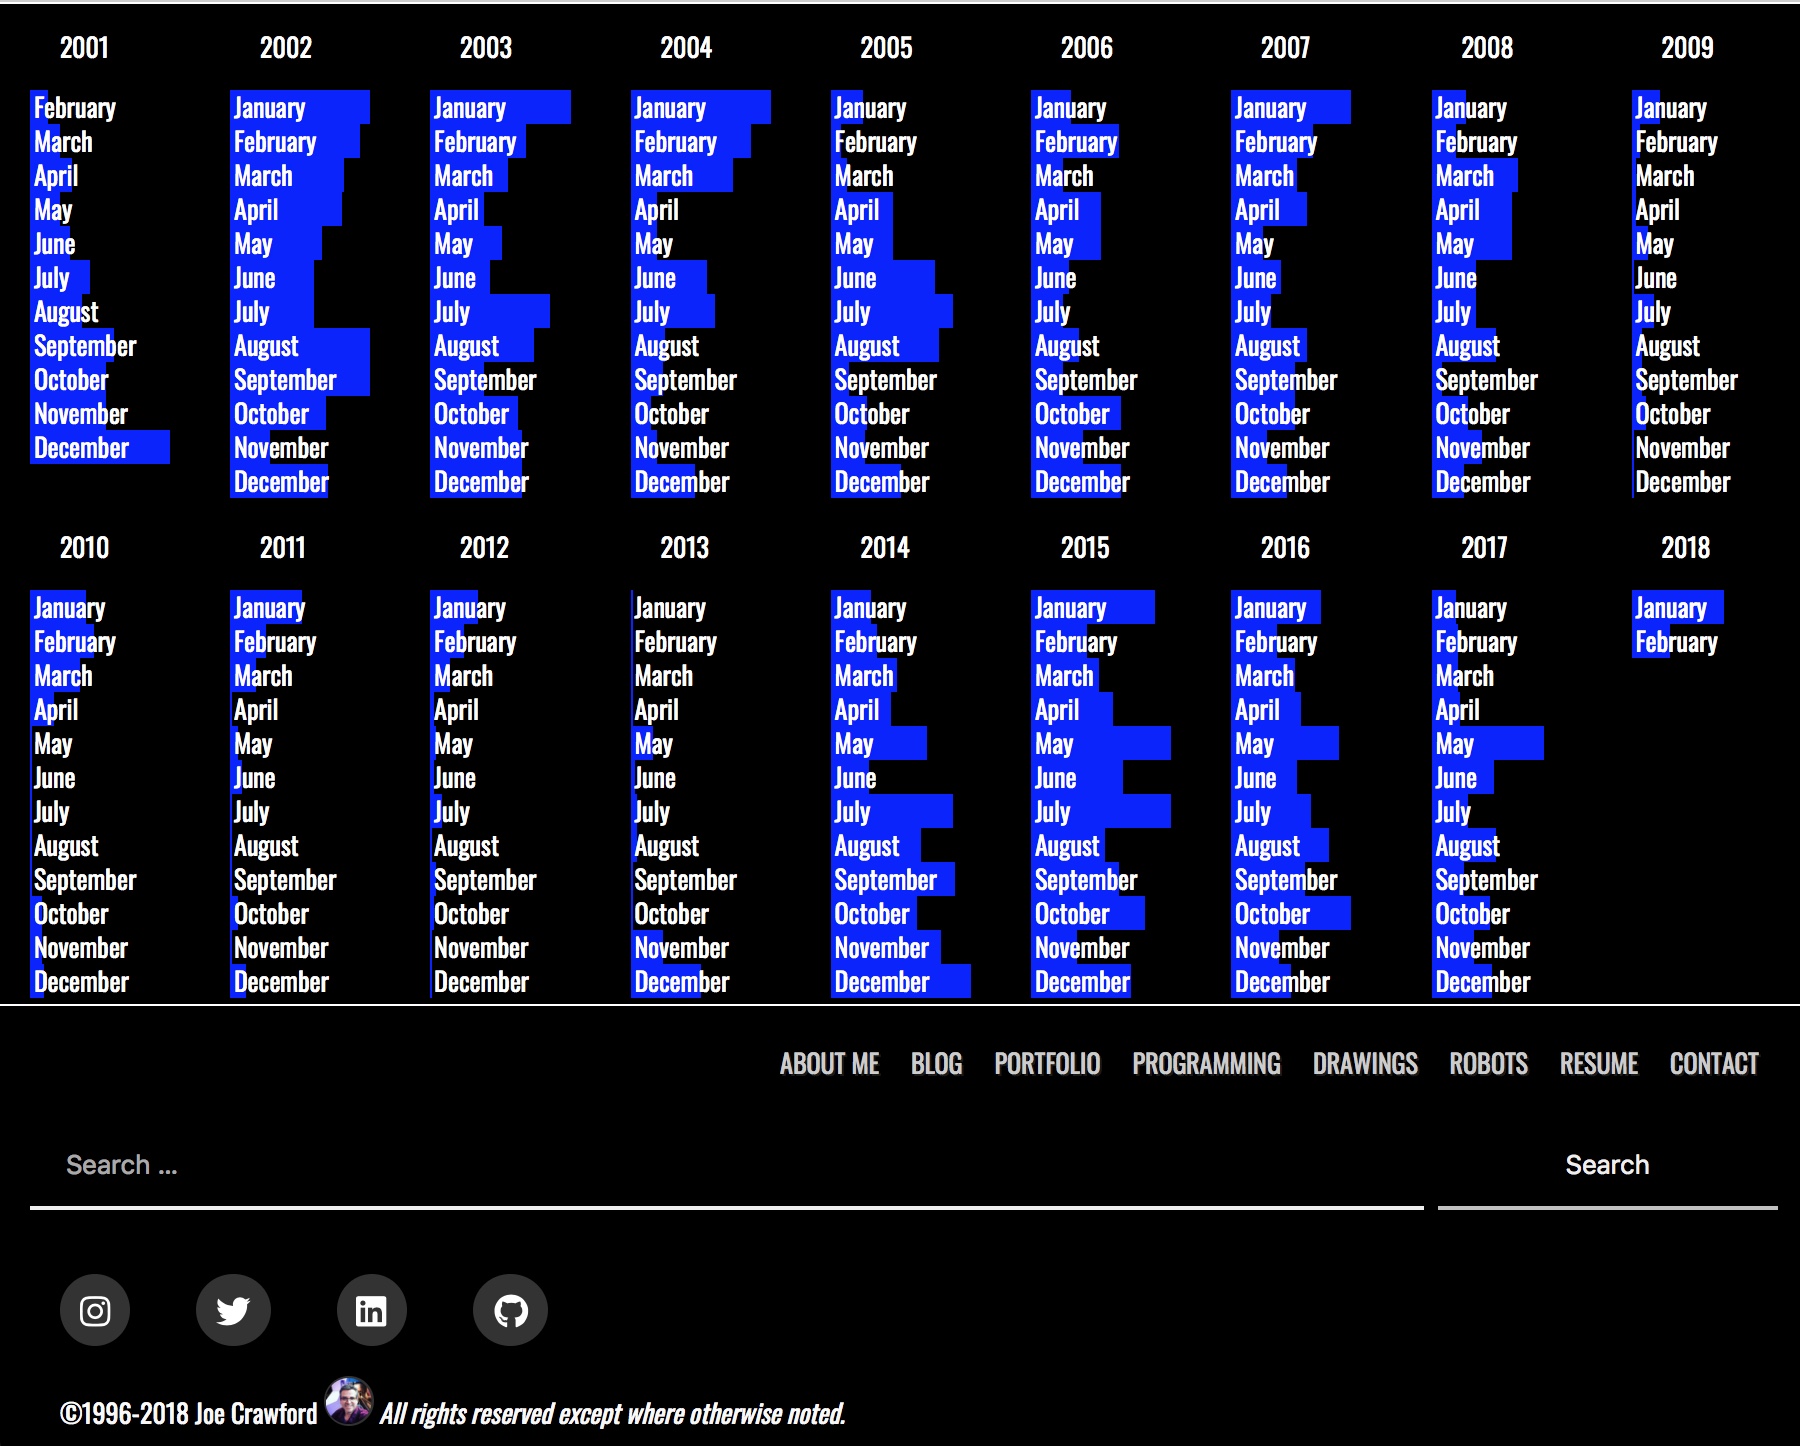
I started blogging in late February 2001. Each line here represents a year of blogging, a line based on the count of posts per day with a bit of added noise added for aesthetic effect. I am fascinated by visualizations of data, and it was fun to toy with the aggregate counts of thousands of blog posts over time and see an image develop. It’s not what I expected it to look like as I exported data from my WordPress instance, but it definitely catches my eye. Inspired by Peter Saville’s iconic album cover for Joy Division’s album Unknown Pleasures. That artwork was based on data from a pulsar.
